INTRODUCTION
Survey123 is an ESRI app used for gathering field data with a smart phone. This is an outline of the tutorial for Survey123 that was followed. The tutorial was provided by ESRI through the learn.arcgis.com website.
OUTLINE
First, a new survey was started. After its creation, sample questions were added to the survey of various types. This included simple text answers, numeric answers, geopoint, multiple choices, and others. The options for questions are shown below. All screenshots are taken from the Survey123 program.
 |
| Options for survey question types |
The tutorial instructed that the survey include emergency preparedness questions. Twenty-three questions were added in total. After the questions were finished, the survey was then published. This made it available to be completed. The screenshot below shoes what the survey looked like on a computer.
 |
| A sample of the survey viewed on a computer |
The survey could also be completed on a handheld device with the help of the Survey123 app. THis was downloaded and the survey was completed on a smart phone. A screenshot of how the survey looked appears below. Notice it follows the same format and looks similar to how it appears on a computer.
 |
| A sample of the survey viewed on a smart phone |
After the survey was completed 8 times to have some sample data, the analysis capabilities were ready to be explored. This included overviews of all the questions and how they were answered. A screenshot showing one question is shown below. Depending on the question type, different information was provided. Notice below, in a multiple choice question, the counts and percentages of each answer are shown. Numeric answers had averages and sums calculated.
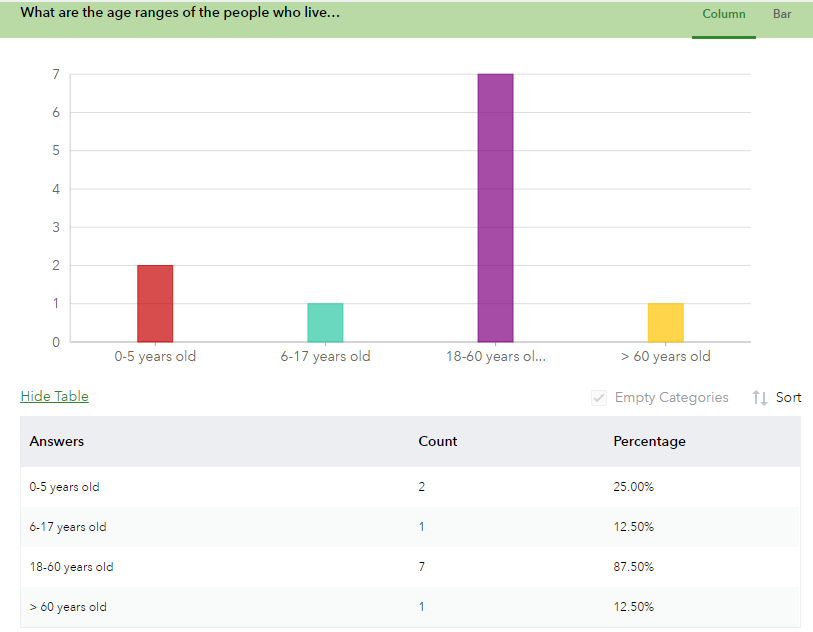 |
| A screenshot showing analysis capabilities of Survey123 |
Another capability of the program was showing all answers for a single survey participant. This was done by showing a map locating all participants in the survey. The answers for each participant are shown at once, rather then overviews of each question like in the previous view. This is shown below.
 |
| A screenshot showing locations of survey participants and what each participant answered |
Lastly, the tutorial instructed on how to bring the data into ArcMap Online. This allowed for viewing it on a map with drop-down displays of each participant. From there, the data could be shared and published.
Since the survey was completed fairly randomly just to get sample data to work with, there were no overall trends or patterns, other than that all of the data came from Eau Claire, as displayed on the map above. With a larger participant base and questions that were relevant to the area, this software could easily be used to view trends and patterns.
This software would be very useful in studies of populations. This could also be used in geographic surveys, where the surveyor enters the measurements they take. The appeal of this software is that it is easy to use and requires no specialized equipment or knowledge to use it.


No comments:
Post a Comment