INTRODUCTION
The goal of this lab was to create a navigation map to be used at a later time. A navigation map is used to help a viewer navigate an area. This is made easier using a grid system so the viewer can easily locate where they are and where they're headed.
An important aspect in the creation of a navigation map is the choice of a coordinate system. A coordinate system is a reference system for the planet, making it possible for every position on the surface to be represented by identifying numbers. These can be geographic coordinate systems, which use coordinates, or projected coordinate systems, in which the planet is mathematically transformed into a planar surface. The second uses a standard unit such as meters for measurement. In this lab, both types of coordinate systems will be used.
METHODS
A navigation area was given for this exercise, which was the Priory in Eau Claire. A DEM that was given was used to create a contour map. First, the DEM had to be clipped down to reduce processing time. Once this was done, a tool was used to create the contour map from the DEM. The contour overlaying the DEM from which it came is shown below.
 |
| DEM of the study area with the contour map created from it |
Notice the resolution of the DEM is not very high, but the contour map created from it still looks usable. A higher resolution DEM was available, but the coordinate system was unknown and it contained no metadata, so it was not usable. The contours are 2 meter separation, which seemed to be the best option. Any higher and the map became too busy, and a lower interval didn't give enough information.
Next, a coordinate system was needed. One map would need to be in degrees in the other in meters. The map in degrees was given WGS 1984 coordinate system, while the map in meters was given UTM Zone 15N.
A crucial part of a navigation map is readability. The map needed to include:
- North arrow
- Scale
- Projection name
- Grid with labels
- Background
- Data sources
- Watermark
- Pace count
These were composed for easy readability. For a background for the map, I gave it satellite imagery from the area. This was made partially transparent so it did not distract from the topographic lines and grid.
RESULTS
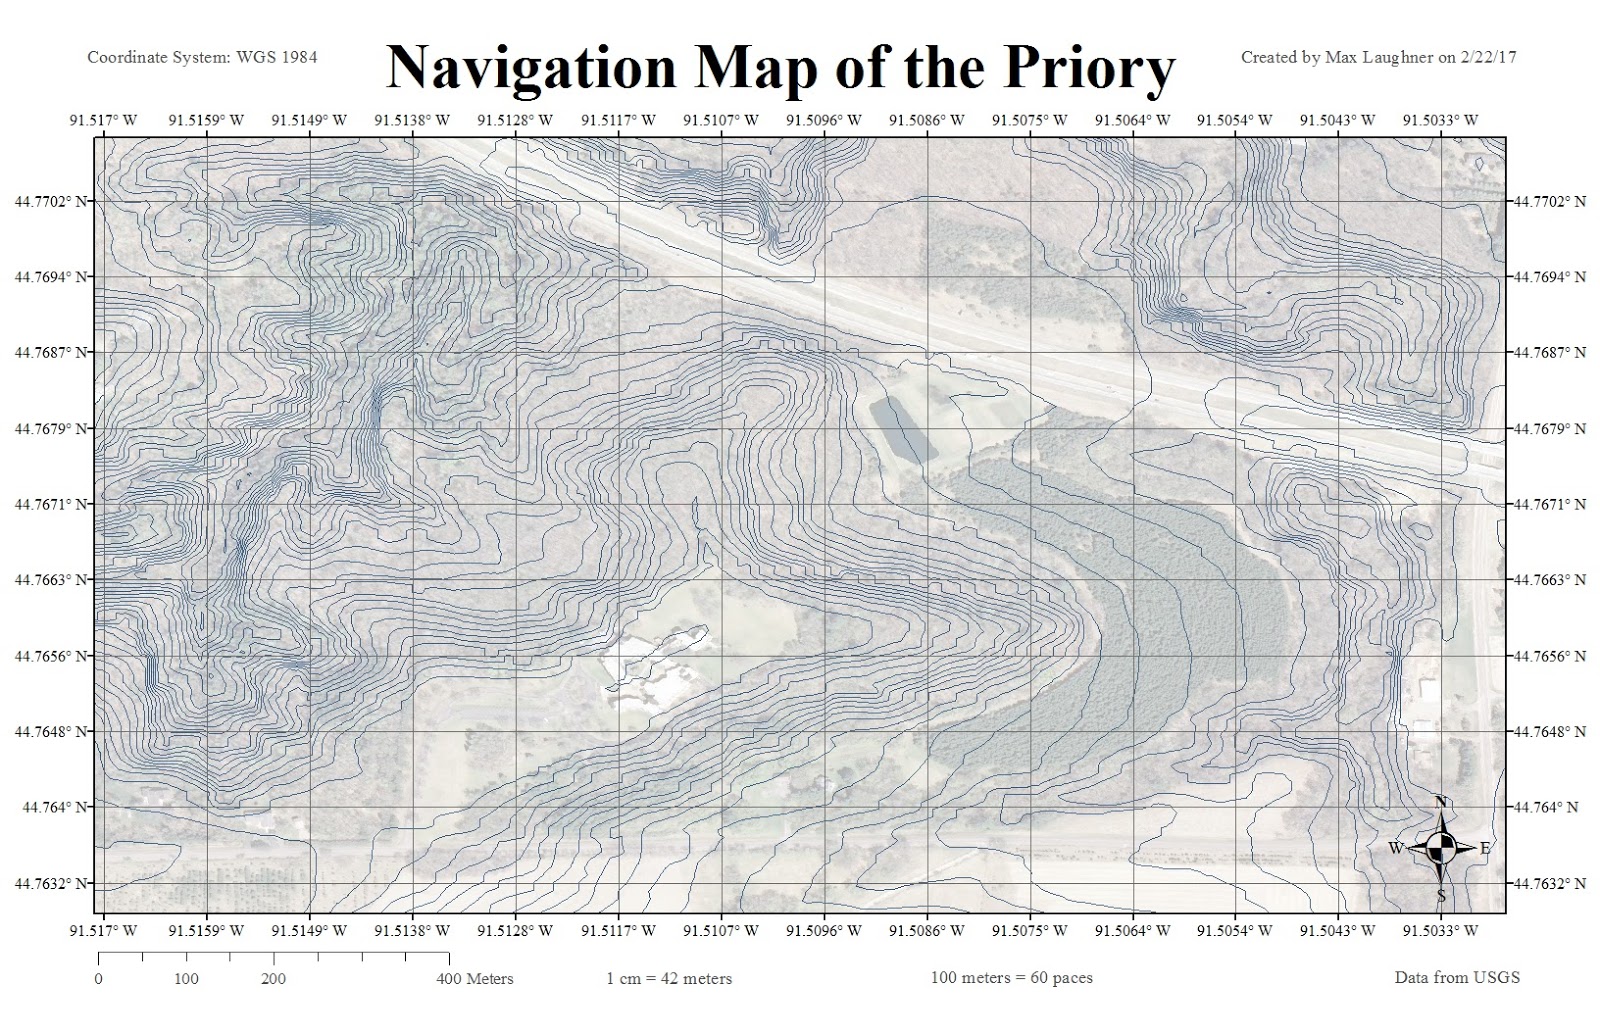
WGS Map
Shown below is the map in degrees. Notice the degree decimals go out to enough digits to provide the necessary information, but not more than that. Any more decimals would become too busy and provide unnecessary accuracy. Similarly, the grid spacing was chosen to provide enough information without becoming overwhelming. The imagery is present behind the topographic lines to provide context.
UTM Map
Shown below is the map in meters. As discussed before, a key component of navigation maps in readability. The last few digits of the meters in the grid labels are bolded, as they are the only numbers that change across the study area. Note that this UTM map is less narrow than the WGS map. This is a result of the different projections.

CONCLUSION
Important components of navigation maps were explored in this lab. It is important to display enough information on these maps to be useful, but not so much information that it becomes difficult to interpret. These maps are intended to be read in the field, so readability is key.


No comments:
Post a Comment